Every pole, splice and port — in one place.

Fiber Genius is the working record of a fibre network: what's built, what's planned, which fibre feeds which house, and how much cable to pull. Built by an ISP, for the way the work actually goes.

In daily use on a live network in British Columbia.

The Fiber Genius map: pole lines running along a town's streets, with splice closures, terminals and subscriber drops drawn on top.
Every screenshot on this page is the real application, running on a demonstration network.
151poles
6fibre cables
28terminals
2,448splice positions tracked

The model

The network, not a drawing of it

Plant is modelled properly — cables know their tubes and fibres, closures know their splices, terminals know their ports — so the map can answer questions instead of just showing lines.

◎

Poles & spans

Owner, height, tag, span lengths and down guys. Strand and fibre lashed along the same route.

✳

Splice closures

A real splice sheet per closure — tube and fibre both ends, colour-coded to TIA-598.

▦

Terminals & ports

Which port is free, and the fibre feeding it. Traced back through splitters to the patch panel.

⌁

Head end

Racks, OLT, patch panels, splitters and every patch cord between them.

Every closure is a real closure

Pick one on the map and you get the actual hardware: model, dimensions, splice capacity, how many cable ports are used, slack loop, and which of the cables crossing that pole it rides.

  • Change the model and the port and tray limits follow
  • Cable ends and pass-throughs counted separately
  • Entry lengths per cable, so slack is in the material count
Properties panel for closure ACM-FOSC-0001: 576-fibre capacity, Apex X-2S dome, 2 of 6 cable ports used, with its two cables listed.
The fibre connections editor: tube list down the side, each fibre with its TIA-598 colour, status and what it is spliced to, and a splice matrix along the bottom.

A splice sheet, not a sticky note

Open a closure and you are looking at every fibre in it: tube by tube, in TIA-598 colours, with what each one is spliced to, what passes straight through, and what is still spare.

  • Splice two cables fibre-by-fibre, or a whole tube at once
  • Pass-throughs stay visible instead of disappearing from the record
  • Trays and statistics tabs for what physically fits in the case

Follow a fibre all the way home

A terminal knows its splitter, the exact fibre feeding it — tube and colour — and which of its ports are free. Ask where that fibre goes and it traces back through every closure to the patch panel, and tells you how far.

  • Port-by-port occupancy, with the subscriber on each one
  • Path length includes the slack coiled in each closure, not just map distance
  • OTDR distances measured from the port you are testing
Terminal ACM-MPT-0002: a 1-to-4 splitter fed by fibre T1-F4 Brown, path length 2884 metres to the patch panel, and its four output ports, one serving a customer.

Planning

Know what's used, what's left, and what's wrong

The model that draws the map also answers the questions you would otherwise work out on paper — and tells you when the design does not add up.

Capacity and health panel: 43 percent of fibres used, PON port usage, subscribers routed, and utilisation bars per cable and per closure.

Capacity at a glance

Fibre and port usage across the whole network, per cable, per closure and per OLT — so you find out you are out of fibre while it is still a plan, not while a crew is up a pole.

  • Utilisation per cable and per splice closure
  • PON ports patched versus available
  • Subscribers routed versus waiting

It checks your work

Continuous checks run over the whole network and point at the specific item. On the demo build they catch ten things — the same kinds of mistake a real design makes:

  • A splitter with no input fibre selected
  • A closure filled to its splice capacity
  • A terminal with no feed cable assigned
  • A customer with no service drop yet

Click any of them to jump to the item on the map.

System warnings panel: two errors and eight warnings, grouped by severity, each naming the item and the problem.
Data table under the map listing splice closures with capacity, slack, fibres used and status, editable in place.

Edit like a spreadsheet when that's faster

The table under the map shares the map's selection. Cells edit in place, Enter moves on, ⌘D fills down a column, and you can paste a block straight from a spreadsheet.

  • Poles, closures, terminals and cables, each with the columns that matter
  • Select a run and change status on all of it at once
  • Export any view to CSV

In the field

Built for standing at the pole

Field Mode is a map with the job on a sheet underneath — everything on one screen, at thumb size, and it keeps working when the signal doesn't.
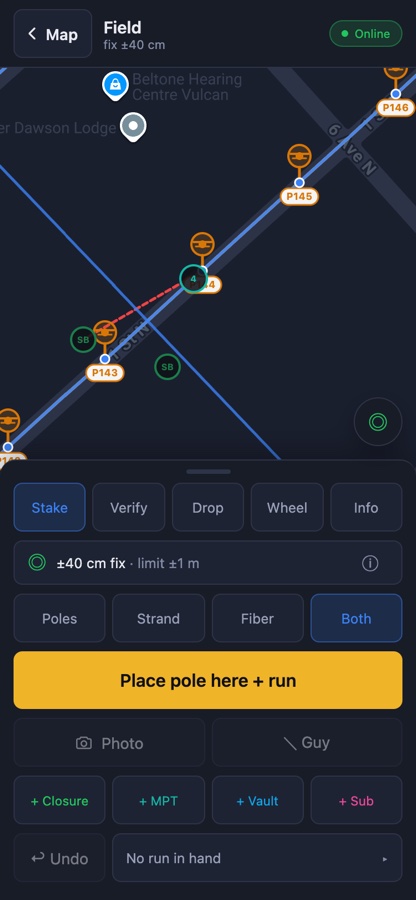
Field Mode staking: a 40 centimetre fix against a 1 metre limit and a large Place pole here and run button.
Stake a pole and carry strand and fibre to it in one tap
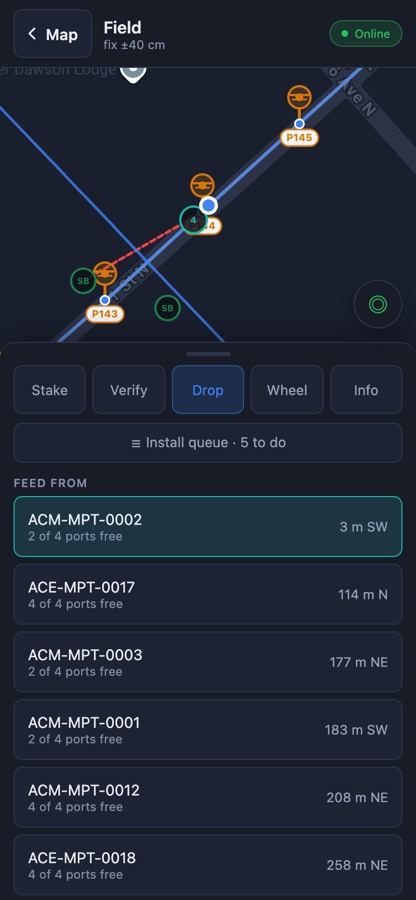
Field Mode drop tab: nearby terminals ranked by distance and bearing, each showing how many of its ports are free, with an install queue of five jobs.
Nearest terminals, ranked, with free ports and the install queue
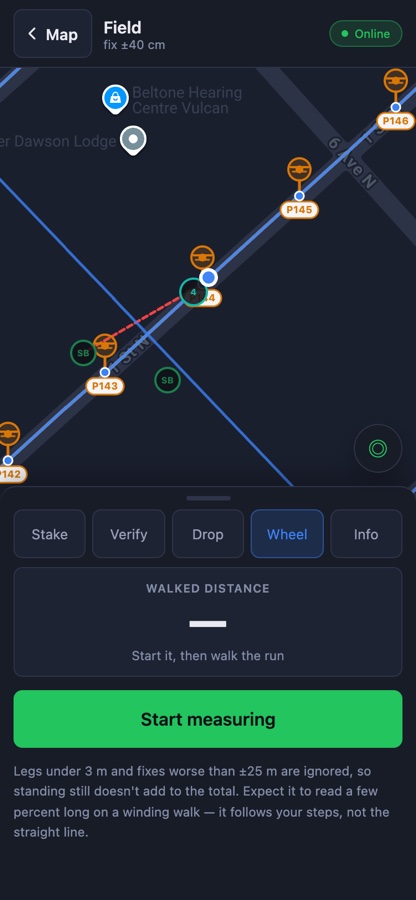
Field Mode measure wheel: a walked-distance readout with a Start measuring button.
Walk the run, get the length
⚑

Stake as you walk

Place a pole where you're standing and carry strand and fibre to it. Park a run to build a branch, then pick the same cable up again.

◉

Survey-grade GPS

Works with an external RTK receiver on Android, and refuses to place plant from a fix worse than your limit. Every placement records the accuracy it had.

☑

Verify what's built

A queue of what's near you to check off, so as-builts come from the field rather than from memory a week later.

⇄

Offline first

Edits keep working with no signal and sync when you're back. Base-map tiles download ahead of a trip, and closer zooms fall back to the nearest saved tile.

Take the map where there is no signal

Save the area you are working in before you leave. Tiles are stored on the device, and the panel tells you where each tile on screen came from — saved, downloaded, or scaled up from a coarser one because you zoomed past what you saved.

Layers panel with base map choices and an offline download button, showing how many tiles are saved and where the tiles on screen came from.

Working together

Two people, one network, no reloading

Edits travel as they happen, item by item, so a planner at a desk and a tech at a pole work on the same network at the same time.

The top bar showing another person is also in this network, with their initials, beside the sync status.
Someone else is in this network right now — their initials sit in the top bar, beside the sync status.
⇄

Live sync

A change is a few hundred bytes on the wire and lands on the other screen in under a second — no save button, no reloading someone else's work.

◍

See who's here

A quiet line of initials shows who else is in the network and roughly where, so two people don't edit the same pole at once.

✎

Who changed what

Every item carries who touched it and when, stamped by the server. If your edit lands on top of someone else's, you are told rather than left to find out.

⛁

Queued when offline

With no signal, edits queue on the device and flush as one batch when it returns — closing the laptop doesn't lose them.

Nothing is ever lost

Every save is kept, newest first, with what changed and who saved it. Restoring an old version creates a new current version — it never deletes history.

  • Each entry lists what it changed: poles added, cables modified, media removed
  • Before a restore, you are told exactly what it would undo — including settings and anyone else's work since
  • Dense history for the last week, thinning with age, kept for good
History dialog listing saved versions with author, timestamp and a summary of what each one changed, each with a restore button.

Paperwork

The submission package comes out of the same data

No redrawing the network to produce a document.

A P408 pole-attachment package previewed in the app: overview sheet with numbered detail boxes, legend, scale bar and title block, alongside controls for revision, sheet size and detail zoom.
A sixteen-sheet P408 package, generated from the plant and updating as you change the settings.

Pole applications

Telus P408 packages — overview sheet, numbered detail sheets, title block, revision block, property boundaries, one-call notice.

Bill of materials

Counted from the plant itself, per area or for the whole network, print or CSV.

As-builts

Because the field crew recorded it as they built it, rather than from memory a week later.

Bill of Materials: fibre and strand totals in metres, pole, closure and terminal counts, broken down by cable type and hardware, with Print PDF and Export CSV.

A materials list you can order from

Every cable type totalled in metres, every closure and terminal by model, drops rounded up to the stock length you actually buy.

  • Whole network or one area at a time
  • Order summary for purchasing, full list for the crew
  • Print to PDF or export to CSV — the same figures either way

The network shown throughout this page is demonstration data — an invented build laid over the streets of a small prairie town, generated so that nothing here shows a real customer's plant. The application, the numbers and the behaviour are real.

Already have an account?

Sign in and pick your network.

Open Fiber Genius